At Team Lucky Little Learners, we are always striving to do our best to assist teachers and make teaching easier and fun. One way we do this is through our facebook groups (more like PLC’s). If you are new to the Lucky Little Learners universe, run and join the right facebook groups for you: Lucky Little 1st Grade Teachers, Lucky 2nd Grade Teachers or Lucky to Learn Math Teachers.
Recently in our Lucky to Learn Math Teachers group, we surveyed teachers: “What is your favorite way to teach data and graphing?” The answers were numerous and helpful! We compiled the answers with the highest frequency for you in a top tips list! Hopefully, this list becomes another tool in your math teaching toolbox!

1- Treats
We all know students LOVE treats. Why not use that sweet tooth to your advantage when teaching graphing? Gather (ask parents to send in a snack) three of four different types, but same category of treats. Some ideas: Goldfish crackers, graham crackers, Ritz crackers or Teddy Grahams. Students can try a sample of each. They should then share their favorite with the class. The result will be a bar graph of favorite class snacks.
Treat Tip #1
Make sure the snacks are of the same category…otherwise chocolate or cookies will most likely dominate votes against a cracker, giving a not great graph sampling.
Treat Tip #2
Make it seasonal: Candy Corn in the fall, conversation hearts around Valentine’s Day, etc. Save time and download our Conversation Heart Graphing sheet below.

Give it a twist
Joel H. says, “Use different types of snacks/packaged foods to count and graphs the different colors and or shapes that are in each pack.” Skittles or M & M’s would work great for this!
2- Graph Student Names
Make students feel special by teaching them their name is important AND can be a graphing tool. Charisse H. shared, “Graph the kids name horizontally. Give each student a small post-it for each letter in their name. They put one letter on each post-it. Then, they place a letter into each column of the chart paper until all the letters are gone. I honestly just love using their names for as many math activities as possible.”
This activity will show who has the longest/shortest names and also how many kids have names with 5 letters, 6 letters, and so on. Use this data to create word problems about the class!
3- Student Survey
This was by far the TOP mentioned idea in our Facebook groups!
After tally charts, surveying and creating bar graphs have all been modeled, set your students free to survey their classmates, families or other teachers. Students should write their own survey question. They will create the tally chart and bar graph based on the answers the receive. Now, don’t start worrying about creating the templates for all fo this! As part of the latest Lucky to Learn Math Unit: Graphing & Data, we have a student Graphing Project ready below.

Join All Access to download everything we’ve ever made.

Or… Purchase the bundle in our shop.

Survey Tip
Have students turn their data into writing pieces. These could be opinion pieces, “The best cookie is Chocolate Chip” or procedural, writing about the steps to create their bar graphs.
4-Basketball Graphing
Lynda E. shared this amazing idea: “Basketball shooting! I have several small wastebaskets and basketballs (from dollar tree) Students take turns shooting the balls into the hoop. They each get 20 shots, then we graph shots made vs. missed. The engagement is off the charts!!”


5-Use Technology
Padlet
On this interactive site, students can answer survey questions during a tech station. They can post their answer with a note, or even record a voice answer (if your little learners can handle the excitement..ha!). Check out Padlet!
Google Forms
Have students create a Google Form for easy survey results!
6- Morning Question
Start graphing on the first day of school! They will answer a daily question on a board or chart by putting their name post-it in their answer column. They will be graphing from day one and not even know it!

7-Weather Graphing
This is a great idea to incorporate into morning meeting. Graph the weather each day of the school year. Students could have a Weather Graphing booklet where they also keep track.
Tip: Use a color that represents the temperature to graph. For example: blue on cold days, orange on nice weather, red on hot days.
Grab our weather reporting form below.
Join All Access to download everything we’ve ever made.

Or… Purchase the bundle in our shop.
8- Tie it in with Science or Social Studies
All teachers know cross curricular resources make the content more engaging and can take care of more than one standard. Data & graphing can easily be cross curricular!
Science
Try teaching graphs within an animal research unit. Students will graph their animal’s characteristics, habitats, diet, etc. (Throw in a map to add Social Studies to the same project.)
If you need an animal report template, grab the one below.
Join All Access to download everything we’ve ever made.

Or… Purchase the bundle in our shop.

Social Studies
Graph habits of people around the world. These habits could be top industries in different countries, age groups of populations, etc. Another idea: Use our Famous Gardens Around the World teaching slides. After students have learned about the gardens, have them complete a bar graph comparing the sizes of the gardens.
Join All Access to download everything we’ve ever made.

Or… Purchase the bundle in our shop.
Another Social Studies Idea
Tie graphing in with lessons on voting and survey the class on their favorites (cookies, sports, colors, etc.)
9- Product Testing
This fun idea comes from Mandi G., “Product testing! Use real examples of different brands of crayons, markers, glue, pencils and of course food! So many different reasons to chart/record data!”
10- Lucky to Learn Math Curriculum
We couldn’t make. Data & Graphing top teaching tips list without mentioning our highly engaging new Math curriculum, Lucky to Learn Math. Teachers are loving this resource, and I think I know why.
Each daily lesson plan is NOT just your whole group lesson. Take a look at the sample plan.
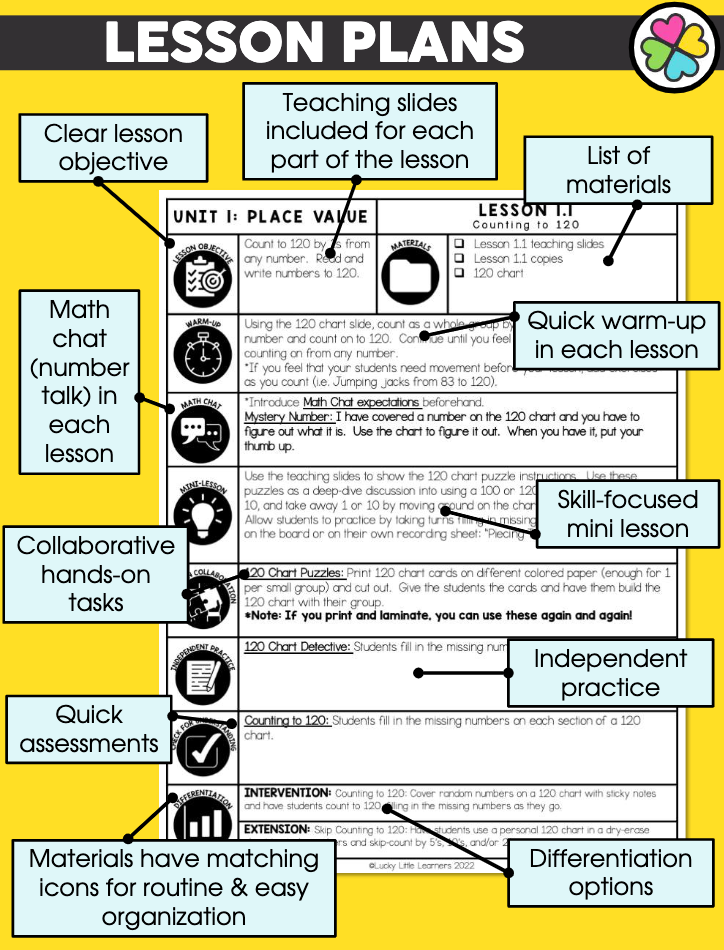
The differentiation options would be perfect small group lessons! With six units already completed, and four more to come, it is an all encompassing 2nd grade Math curriculum. It could be used as a stand alone curriculum or a supplement. Each lesson incorporates Science, Social Studies or SEL skills.

Our latest unit, Graphs & Data will have students creating bar graphs, tally charts, surveying, pictographs and more. The graphing project mentioned above is also part of this unit. It also features 15 lessons, each highlighting a different scientist 👩🔬

Grab our Graphs & Data unit (or the whole year bundle) today and make teaching math easy!
Join All Access to download everything we’ve ever made.

Or… Purchase the bundle in our shop.

Happy Teaching!
